110 lines
7.3 KiB
Markdown
110 lines
7.3 KiB
Markdown
# Setup and Monitor Live Reports
|
|
|
|
Live Reports give you real-time visibility into distributor activity across your project areas. You can create a report, assign users, and select specific maps to track. As distributors operate, their movement history is recorded and displayed visually on the map. You'll also be able to monitor area coverage progress and view hourly location posts through the dashboard.
|
|
|
|
## Create a Live Report
|
|
|
|
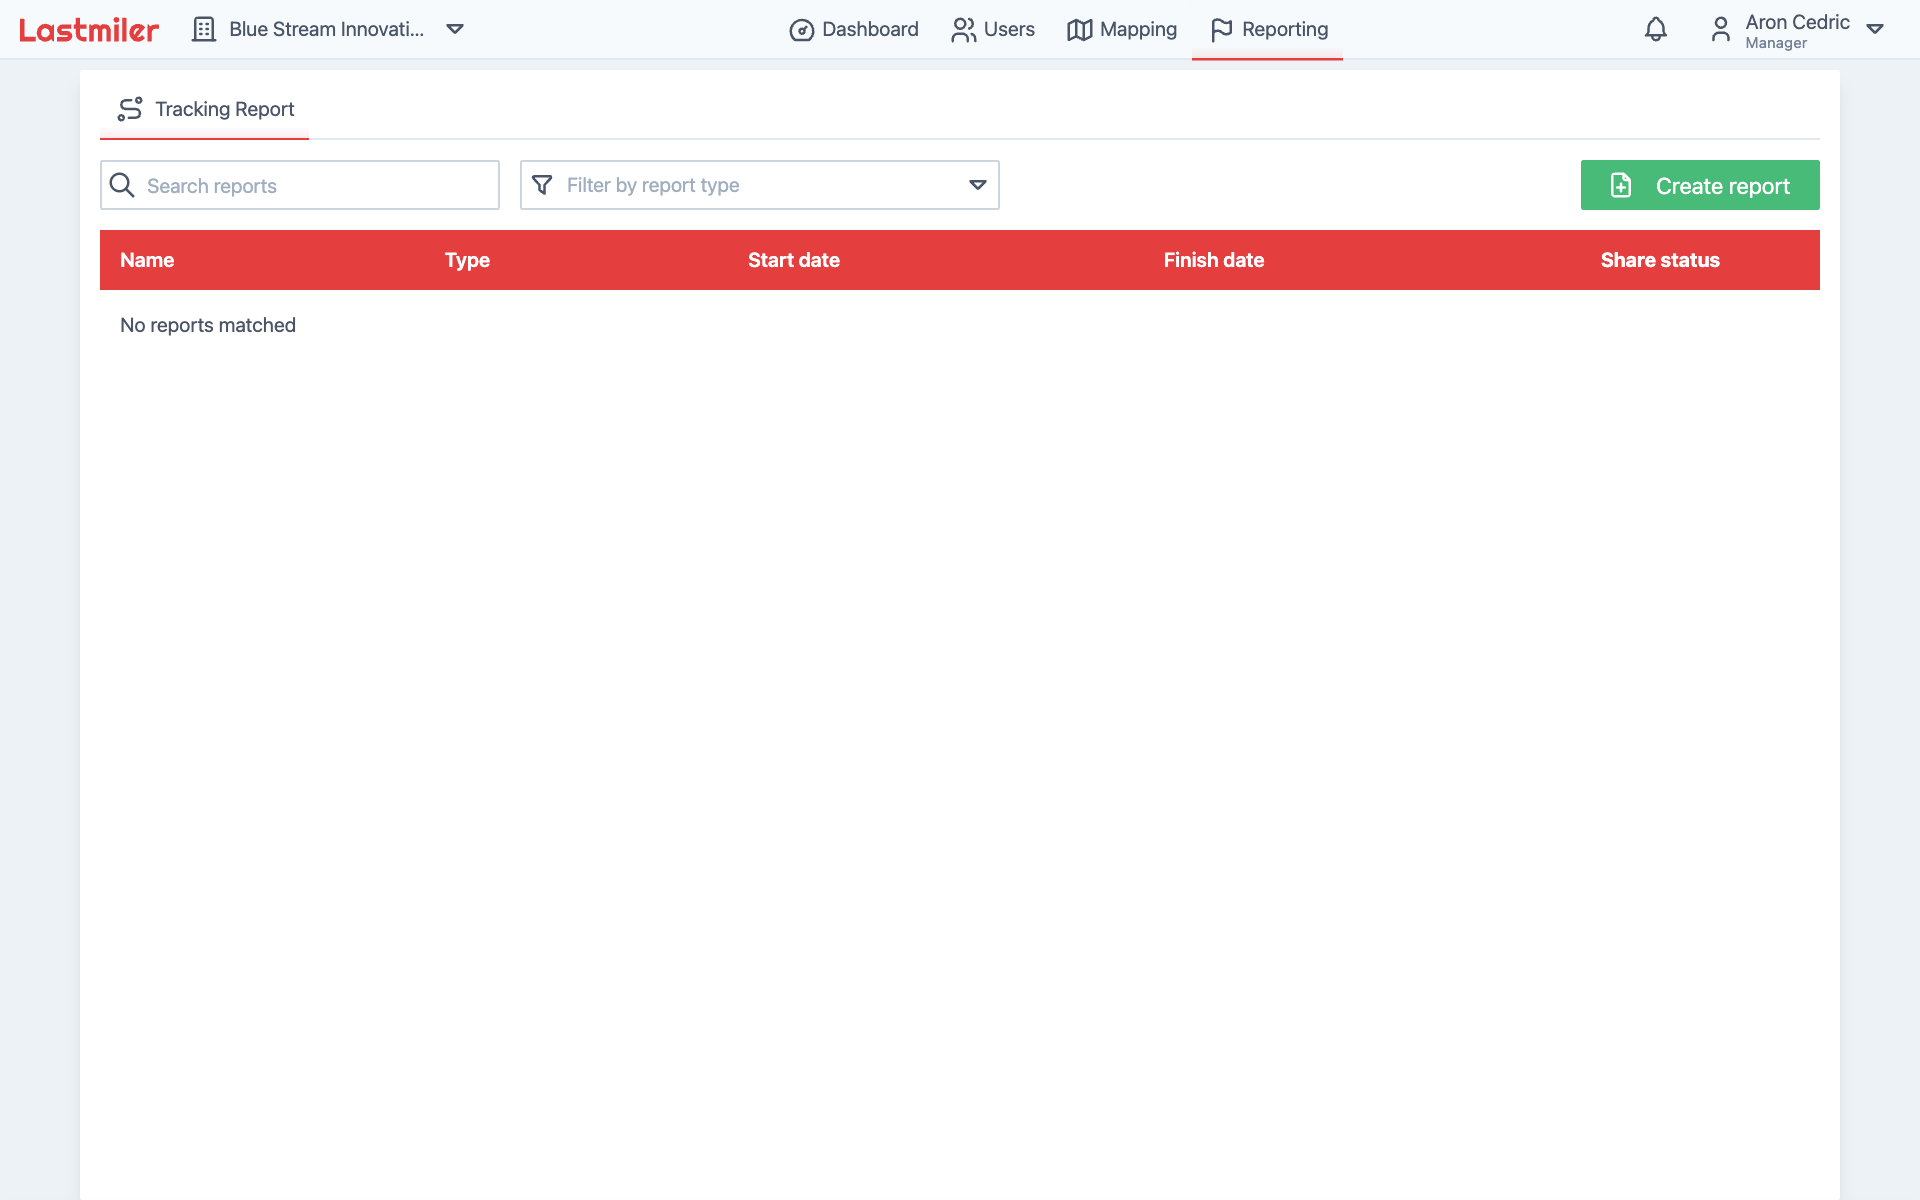
To create a live report go to the **"Reporting"** page.
|
|
|
|
|
|
|
|
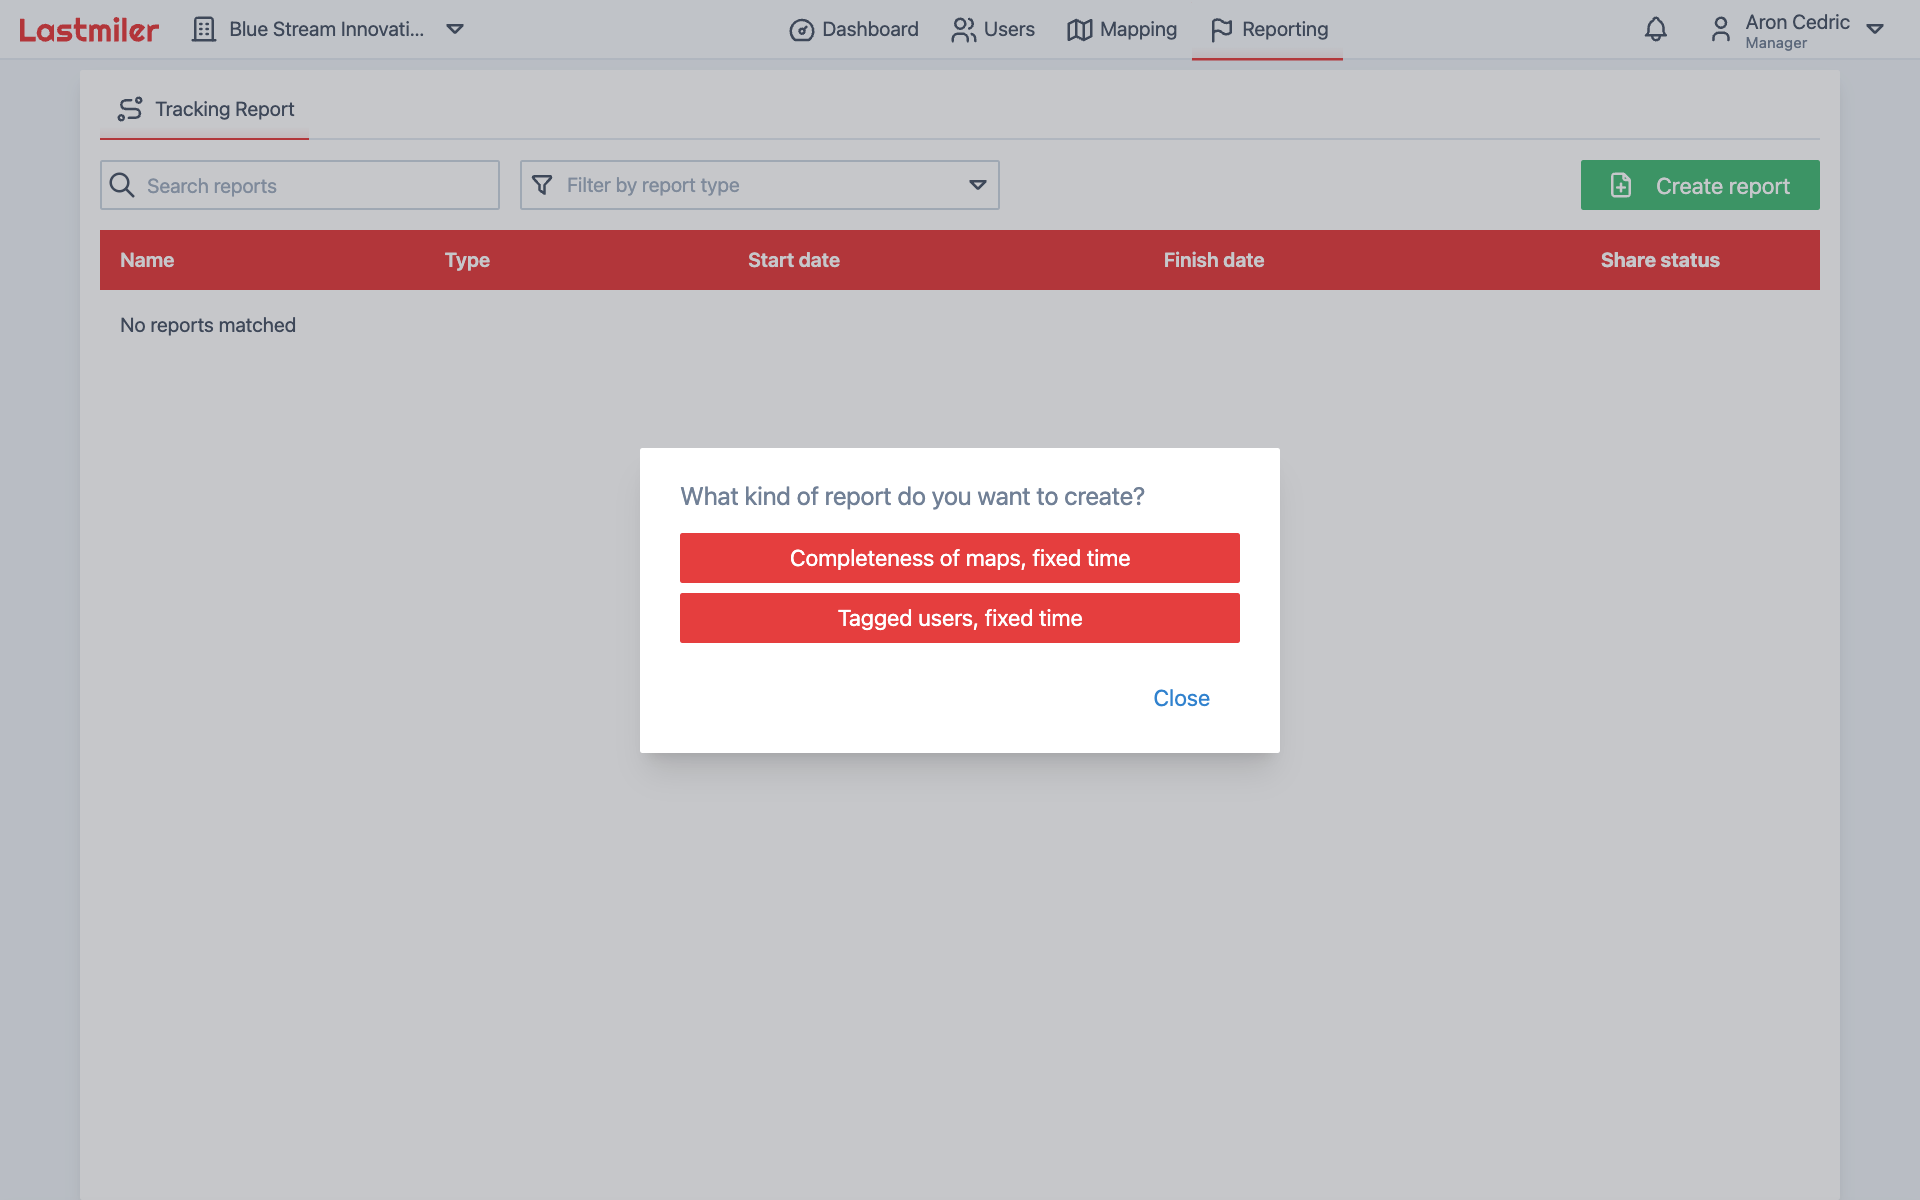
Click on the **"Create Report"** button in the top right corner.
|
|
|
|
|
|
|
|
- You will be prompted to select the type of report you want to create.
|
|
- After selecting the report type, you will be taken to the report creation form.
|
|
|
|
> The difference between the **"Completeness of maps, fixed time"** and **"Tagged users, fixed time"** is that the first offers property coverage.
|
|
|
|
|
|
|
|
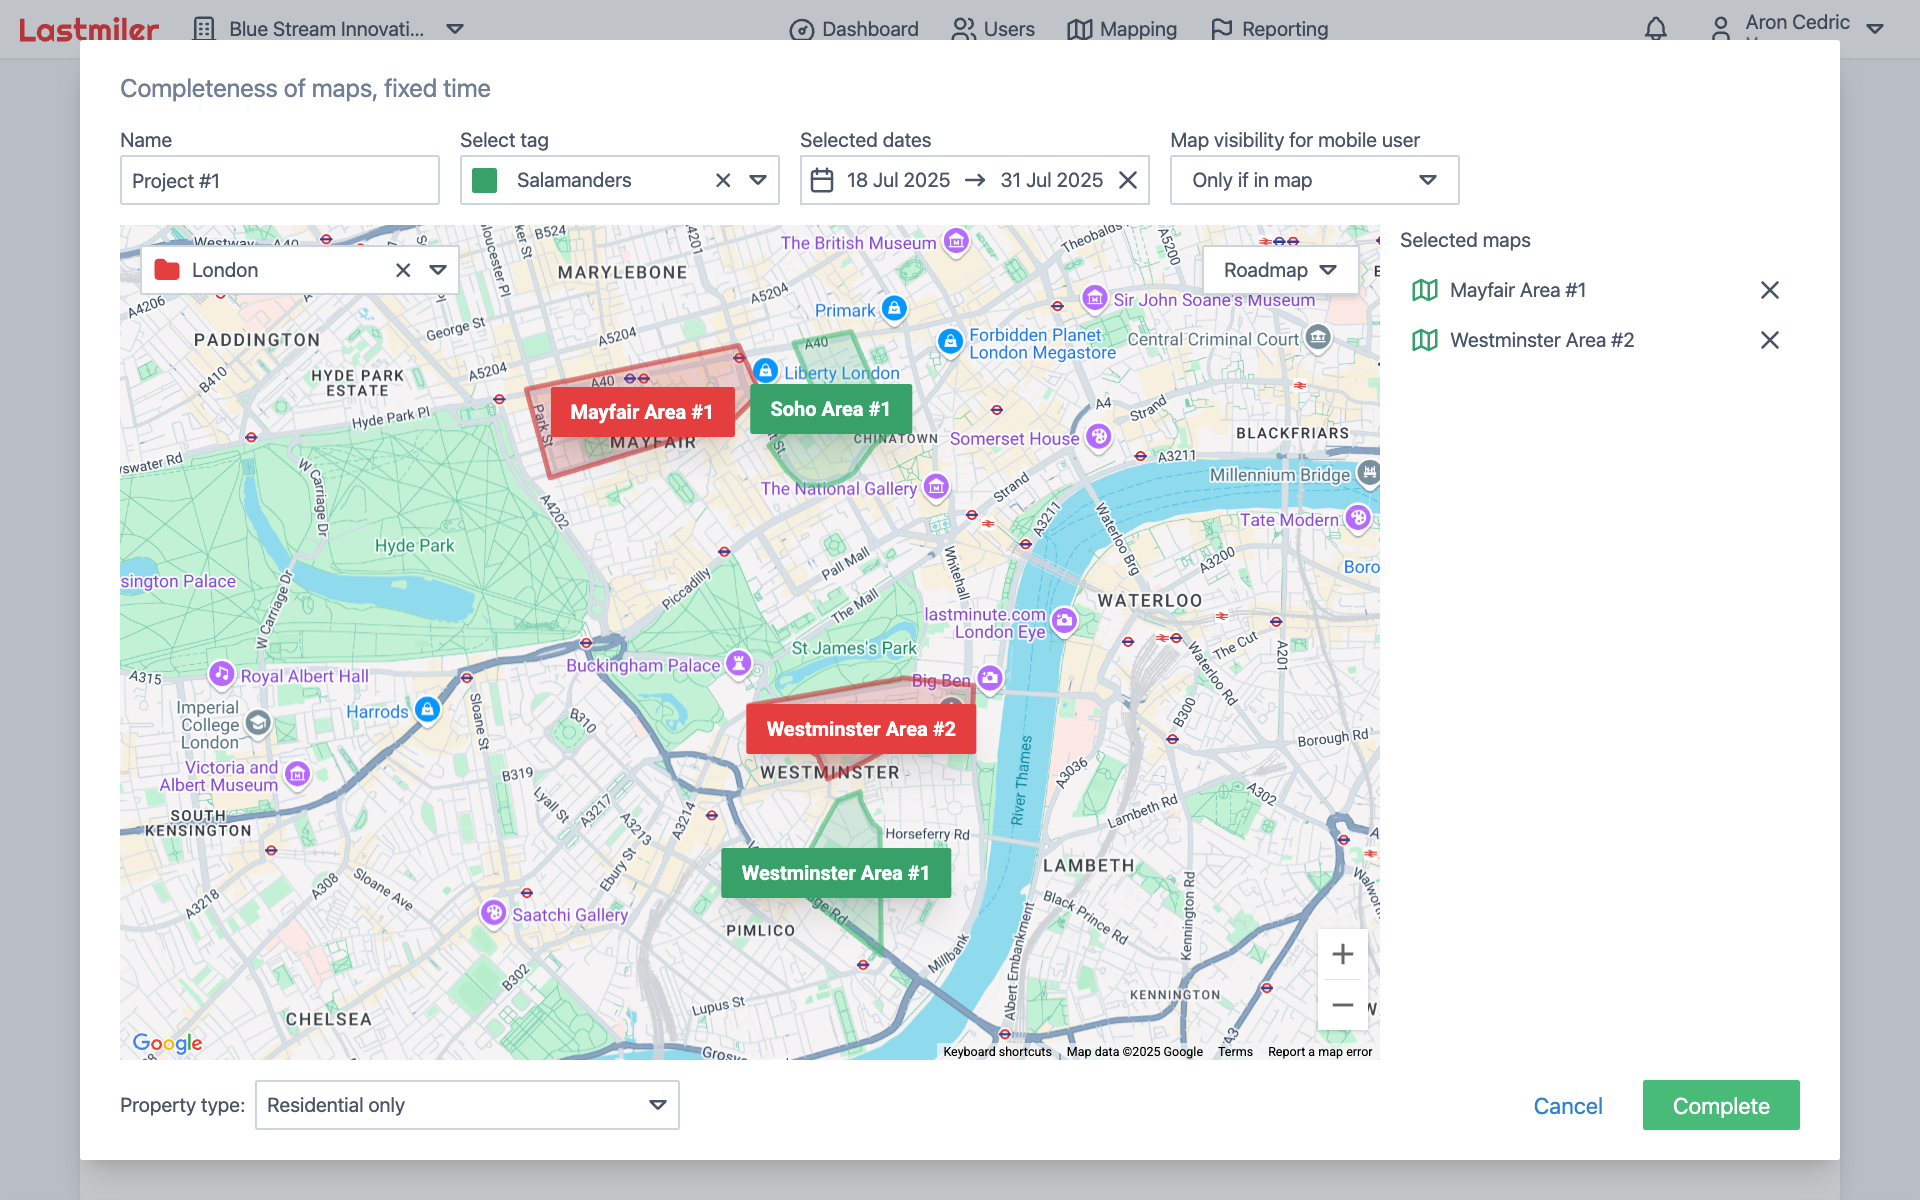
Here you will fill the following details:
|
|
|
|
- **"Name"**: Enter a descriptive name for your report
|
|
- **"Select tag"**: All mobile users with this tag will be included in the report
|
|
- **"Selected dates"**: Choose a start and end date for the report
|
|
- **"Map visibility for mobile users"**: Select which maps will be visible to mobile users during the report, available values are:
|
|
- **"None"**: No maps will be visible to mobile users attached to this report
|
|
- **"Only if in map"**: The mobile users will only see the maps they are currently in geographically
|
|
- **"All"**: All maps within this report will be visible to mobile users attached to this report
|
|
- **"Map selection"**:
|
|
- Map selection is done by selecting the folder from the list located in the top left corner of the map itself.
|
|
- Once the folder is selected, all maps within that folder will be rendered on the map.
|
|
- Clicking on the map will select it, this is indicated by map changing color to red, and map name appearing in the **"Selected maps"** panel.
|
|
- **"Property type"** located in the bottom right corner is only available for "Completeness of maps, fixed time" report type and allows you to select which property types will be included in the report. Available options are:
|
|
- **"Residential"**: Includes residential properties
|
|
- **"Commercial"**: Includes commercial properties
|
|
- **"Commercial and Residential"**: Includes commercial and residential properties
|
|
|
|
## Viewing and Monitoring Live Reports
|
|
|
|
Once you have filled in all the details, click the **"Complete"** button in the bottom right corner to create the report.
|
|
|
|
|
|
|
|
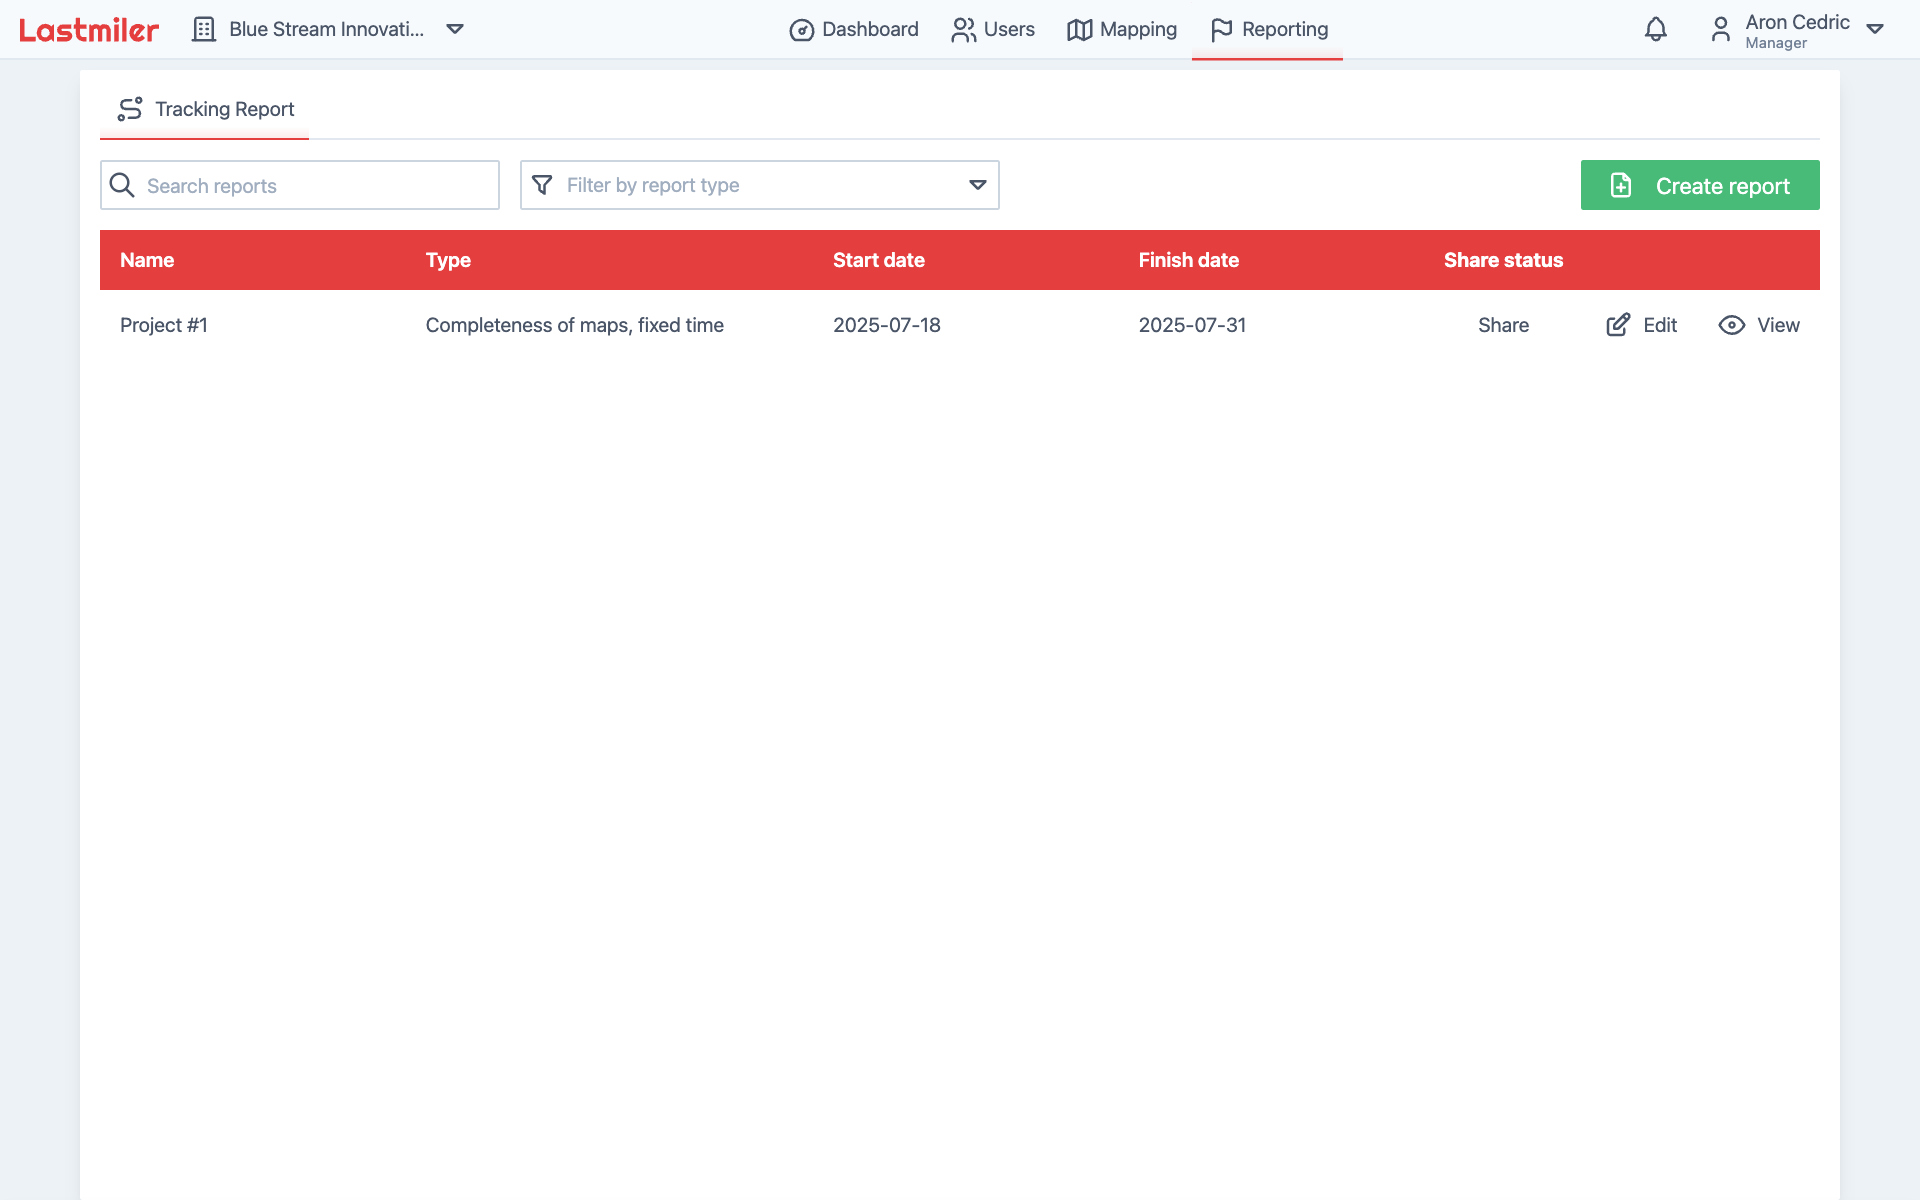
To view and monitor your live reports, from the **"Reporting"** page, click on the **"View"** button next to the report you want to monitor.
|
|
|
|
### Report Overview
|
|
|
|
|
|
|
|
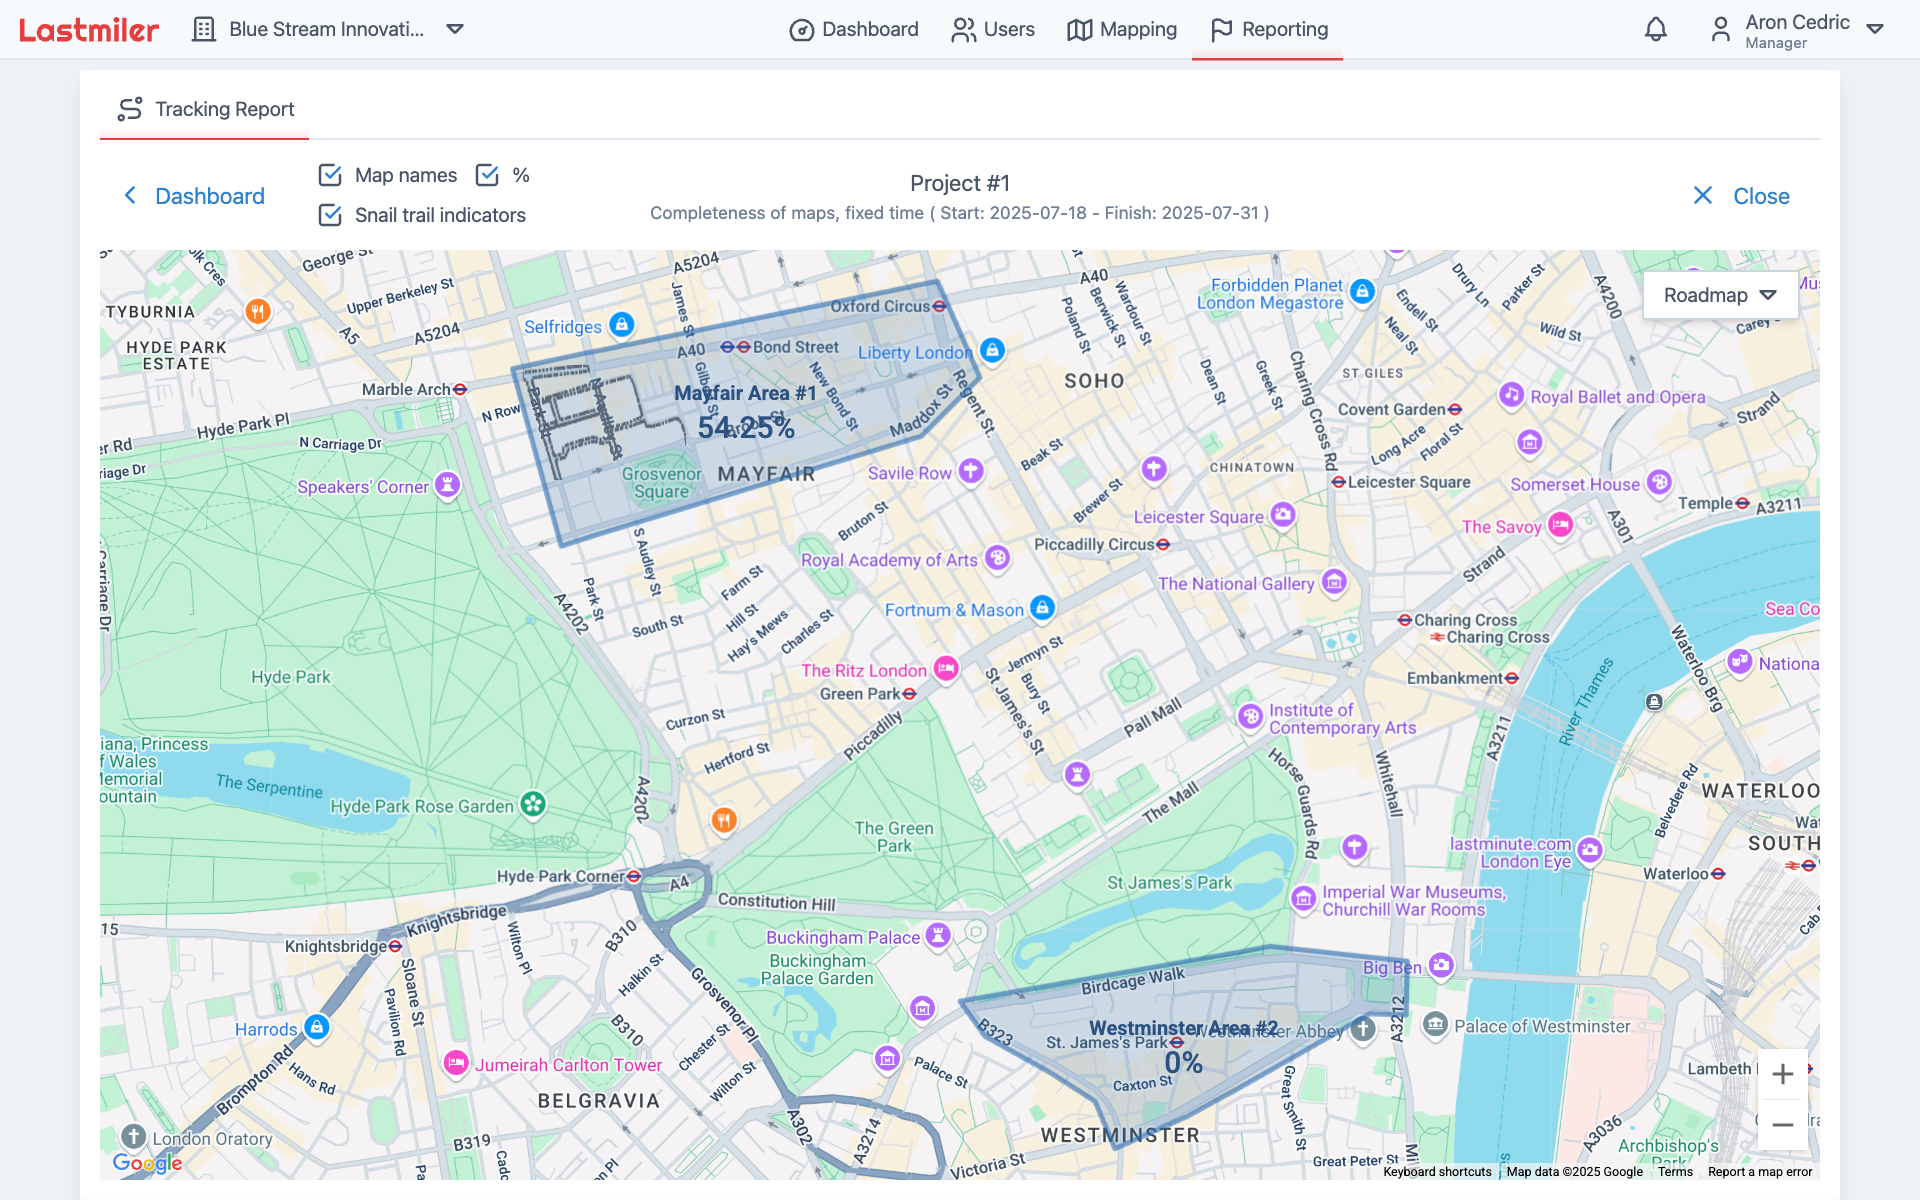
This will take you to the report overview. In the top center of the page you can see the report name, type (e.g., "Completeness of maps, fixed time"), and the start and end dates of the report.
|
|
|
|
The main area of the page is the map, which displays the map areas, names, distributors history (represented by gray dots), area property coverage in percents.
|
|
|
|
Above the map towards the left side, you have checkbox filters to customize your report overview.
|
|
|
|
To view the detailed information for a specific area, simply click on the area on the map. This will bring up a sidebar with more information about the selected area, including its name, property coverage, and distributor history.
|
|
|
|
### Report Detailed View
|
|
|
|
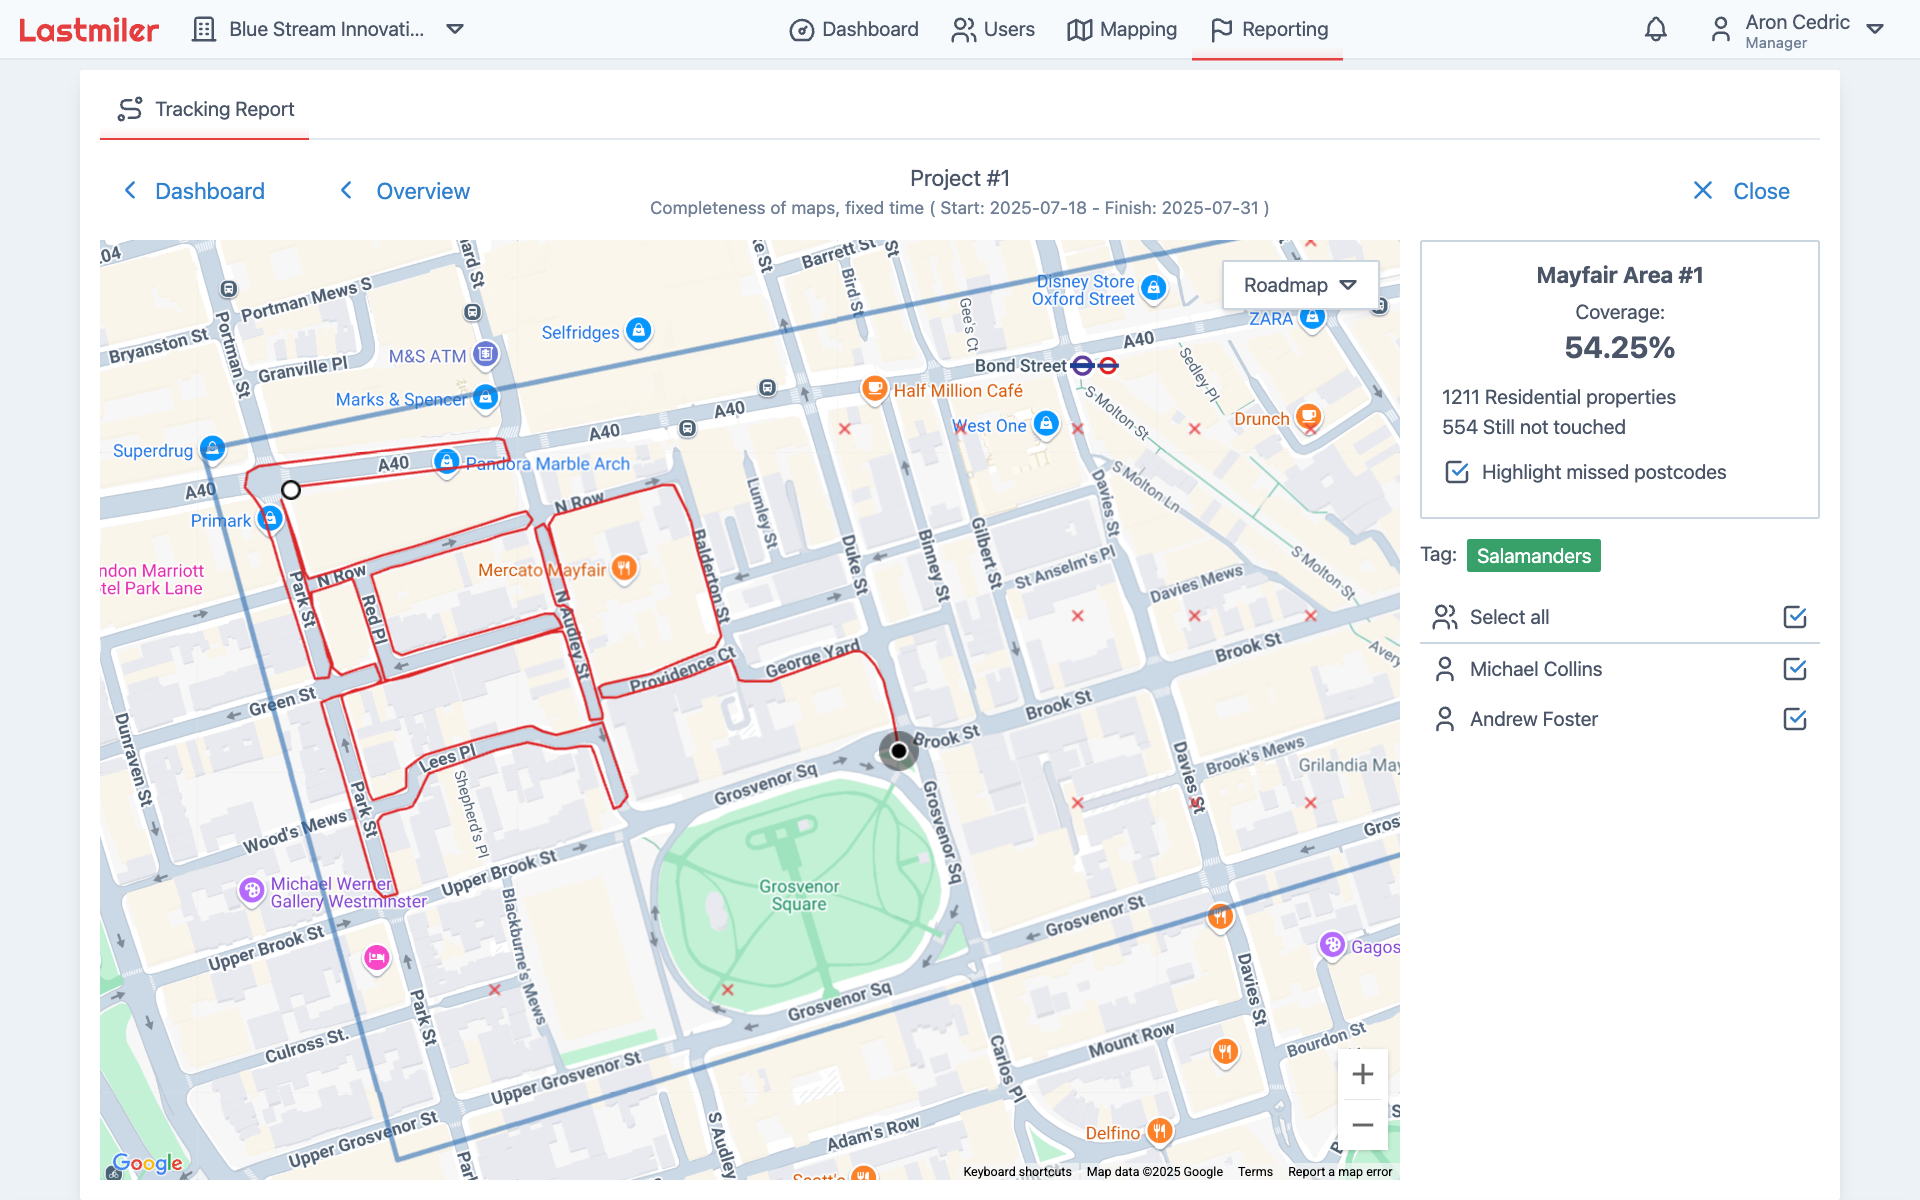
Here you have real-time information about the selected report, including the map with the area of interest, property coverage, and distributor history.
|
|
|
|
|
|
|
|
In the report detailed view, you can see more granular information about the selected area in the side panel right of the map. This includes:
|
|
|
|
- The name of the area
|
|
- The percentage of properties covered in the area
|
|
- A count of properties touched by distributors
|
|
- Checkbox to show/hide missed proerties on the map
|
|
- Attached user tag
|
|
- A list of distributors assigned to the report, and checkbox for each user to show/hide their history on the map
|
|
|
|
The map now shows detailed distributor information, the oldest location is represented by a white circle with a black border, and the newest location is represented by a black circle with a white border. The light gray halo around the newest location indicates that the distributor is currently active in the area.
|
|
|
|
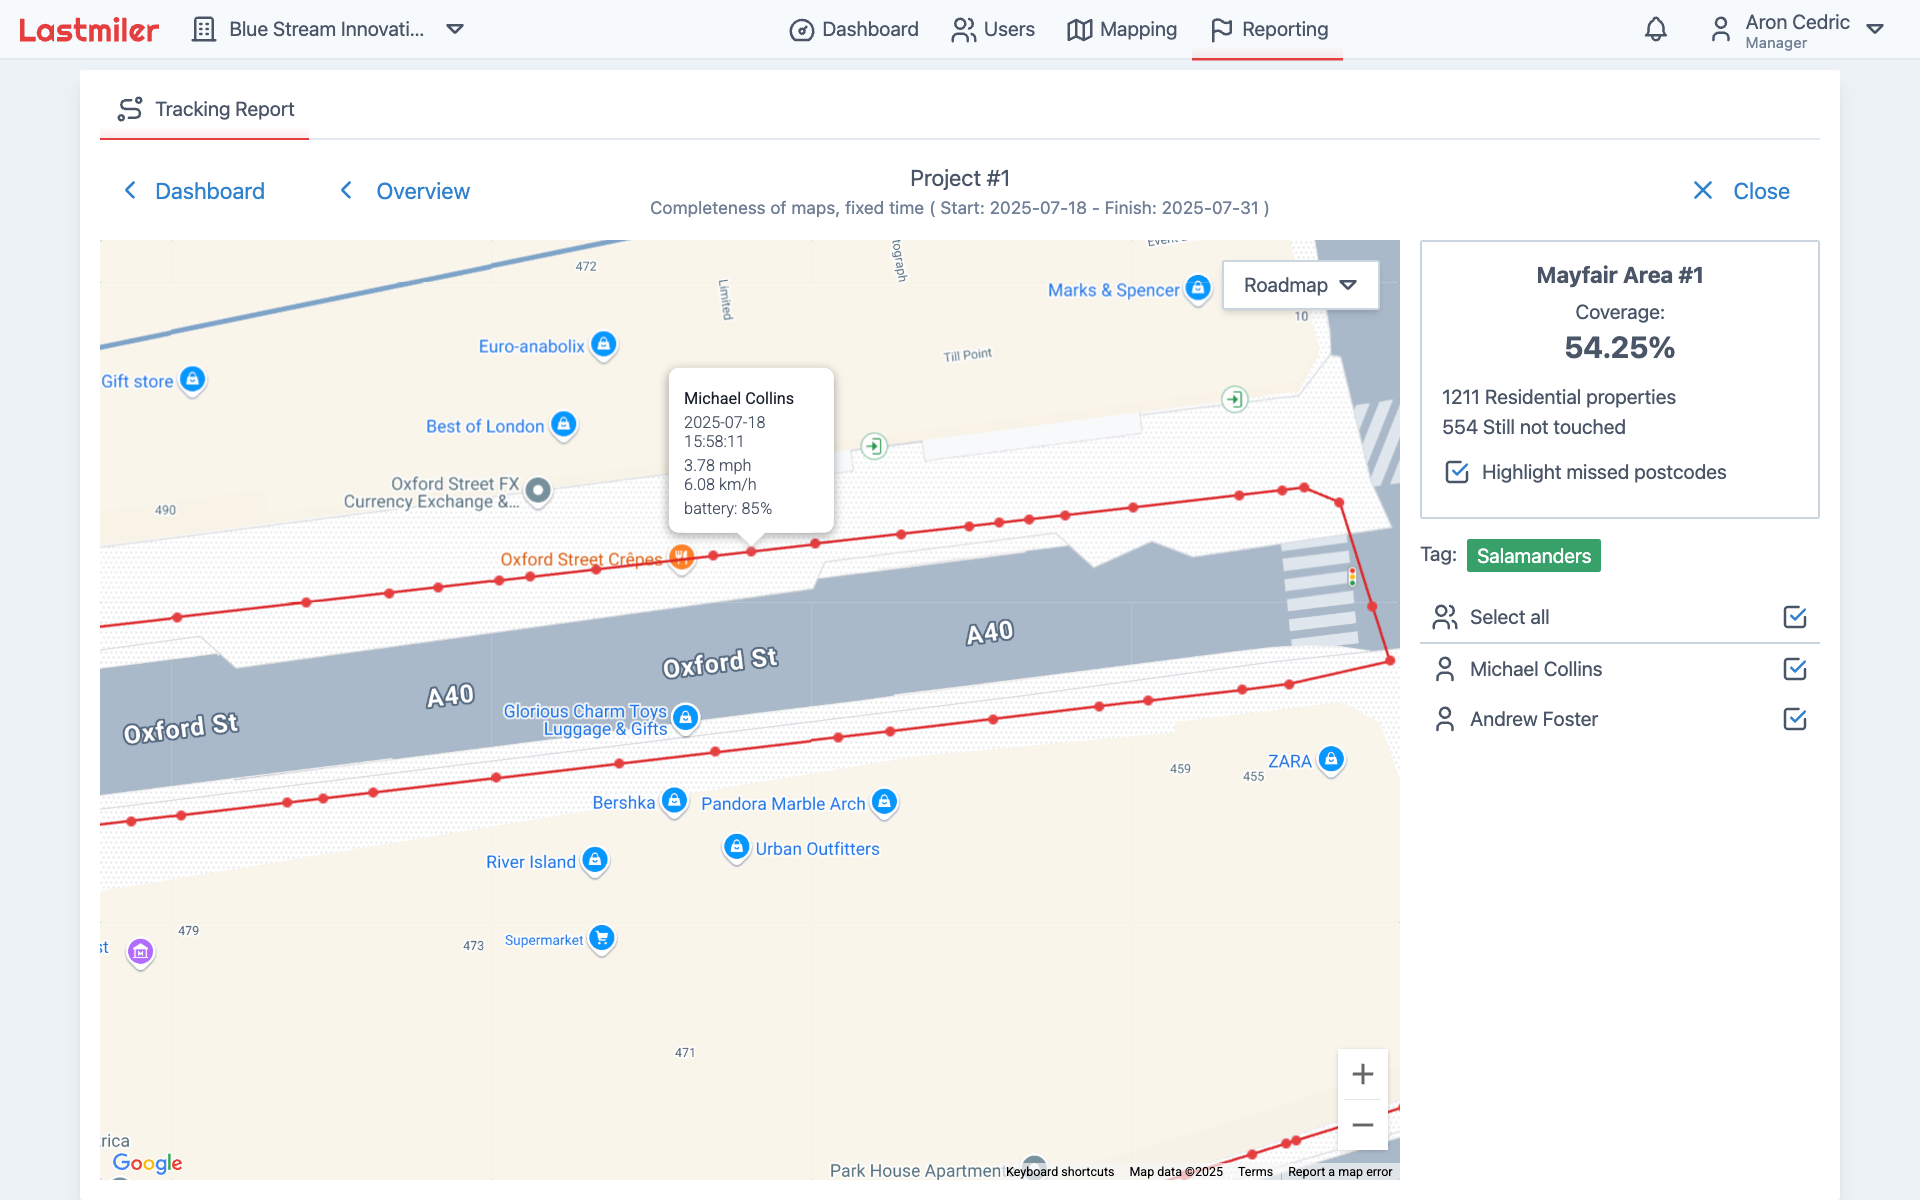
To view detailed location information, simply zoom on the area of interest on the map.
|
|
|
|
|
|
|
|
The red dots will apear along the distributor path, hovering over them will show you various information about the location, like date, time, speed and battery level.
|
|
|
|
## Dashboard
|
|
|
|
The dashboard provides an overview of all live reports, allowing you to monitor their progress and performance.
|
|
|
|
### Current Reports
|
|
|
|
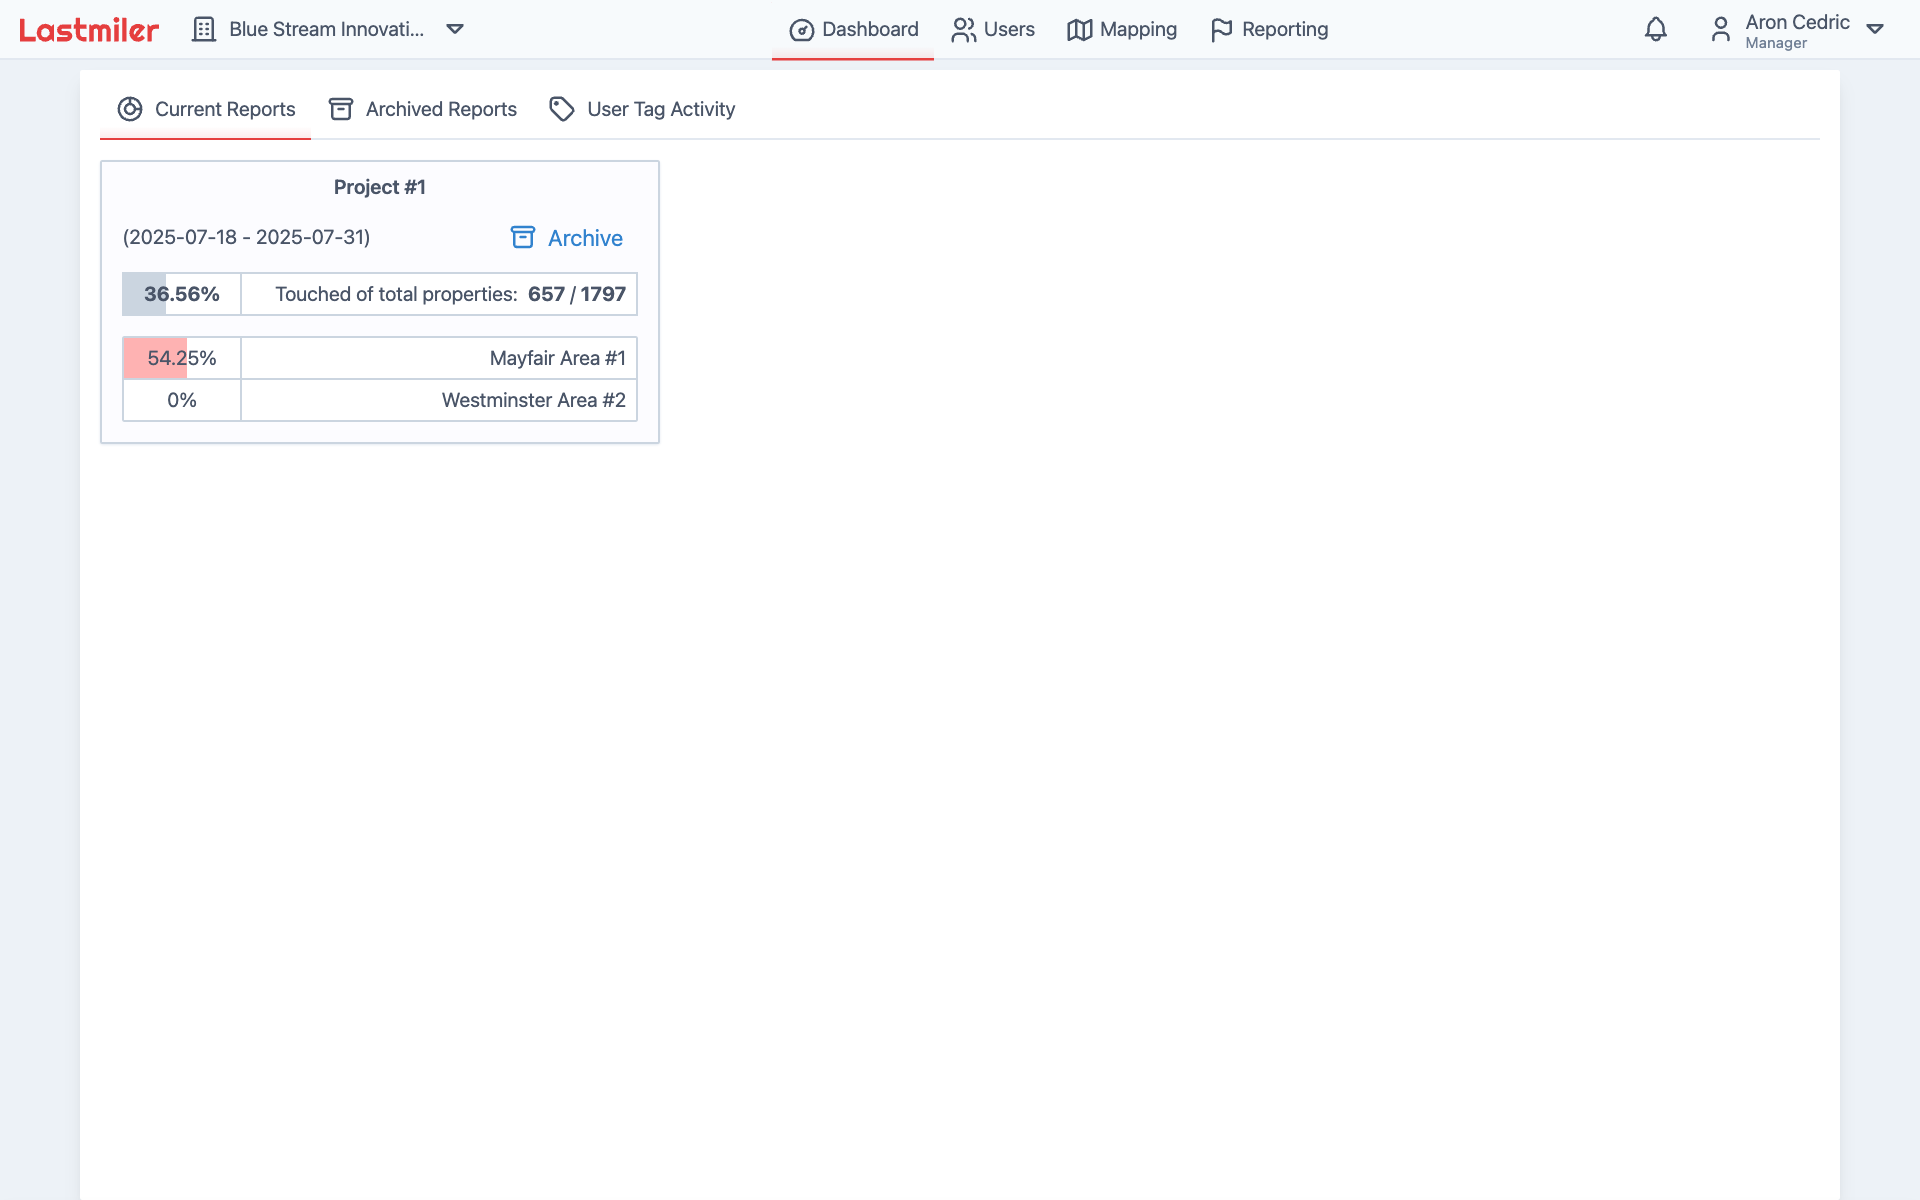
To view the report progress of all active reports, go to the **"Reporting"** page and click on the **"Current Reports"** tab.
|
|
|
|
|
|
|
|
Here you will see all of your active reports, along with the overal progress of each reportin percentage and in total number of properties covered. You can also see the progress for each individual map within the report.
|
|
|
|
These reports can be archived by clicking on the **"Archive"** button next to the report name. You can find archived reports in the **"Archived Reports"** tab and restore them if needed.
|
|
|
|
### User Activity
|
|
|
|
To view the activity of all users, go to the **"Reporting"** page and click on the **"User Activity"** tab.
|
|
|
|
|
|
|
|
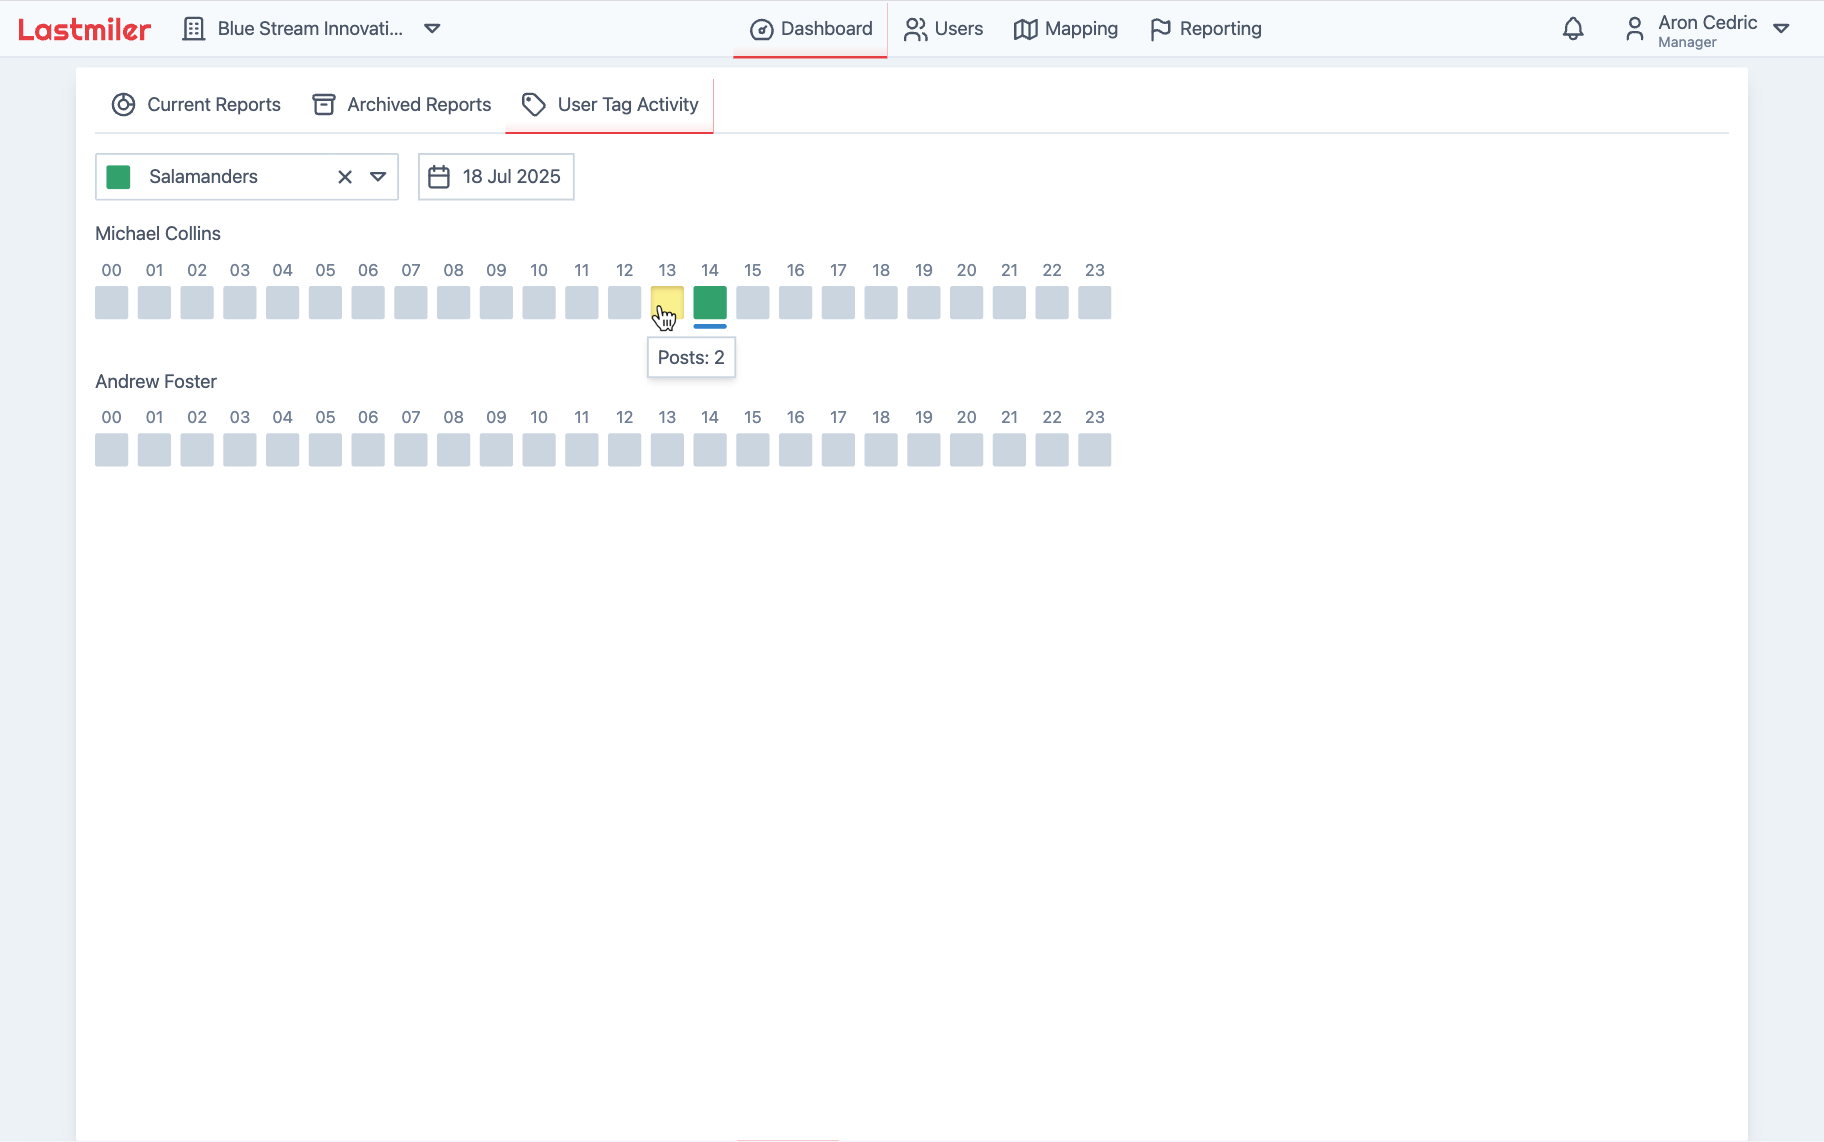
Here you can select a user tag to display all users within that tag, then select a specific date to view post activity within a 24-hour span for that day. The activity is visualized using color-coded boxes for each hour:
|
|
|
|
- **Gray boxes**: No activity (0 posts)
|
|
- **Yellow boxes**: Low activity
|
|
- **Green boxes**: High activity
|
|
|
|
You can hover over any specific hour to see the exact number of posts for that time period. For the current date, a blue indicator appears below the current hour to show real-time progress.
|